
15 Feb Diagnosing Osteoporosis: Beyond the T-Score and Bone Density Scan
What scans miss—and what getting off the floor can tell us
Note: This article has been revised in April 2026, to reflect recently published research on bone density assessment, including studies examining REMS (Echolight) technology and how its results are derived and interpreted.
By Dr. Claudia Welch
 Many of us are told we don’t need a bone density scan until we turn 65. That’s the standard guideline for women without obvious risk factors. Just wait, the system says. Then, at 65, we’ll get a test that tells us whether we have osteoporosis.
But what if that’s too late?
And what if the number doesn’t tell the whole story?
And what if the system that created that number wasn’t designed with your race, ethnicity, or personal history in mind?
The T-Score: A Misleading Gold Standard?
Our bone density peaks around age 30, then begins a slow decline. After age 35, women typically lose 0.3–0.5% of bone mass per year until menopause. But the first 3 to 5 years after menopause—typically spanning from around age 50 to 55—bring an accelerated drop. During this specific window, women may lose 2–3% per year. While that’s considered physiologically “normal,” it’s not benign: this period is associated with elevated immediate fracture risk, especially in the spine, and can also increase fracture risk later in life by lowering the overall bone reserve [Susan L. Greendale et al., “Bone Mineral Density Loss in Relation to the Final Menstrual Period in a Multiethnic Cohort: Results from the Study of Women’s Health Across the Nation (SWAN),” Journal of Bone and Mineral Research 27, no. 1 (2012): 111–118.]
After this accelerated menopausal phase, the rate of bone loss tends to slow to about 1% per year through the 60s, and further slows again to about 0.5% per year after age 70. These later, lower rates of loss are still important to monitor, but the window immediately following menopause remains the most rapid and impactful phase of bone change for most women.
The most common way osteoporosis is diagnosed is through a number called a T-score. This score comes from a DEXA scan—a painless, low-radiation X-ray that takes about 10 to 15 minutes. It measures how dense your bones are, usually in your spine, hip, and sometimes forearm or wrist. You lie flat on a padded table, fully clothed, while the machine quietly passes over your body. That’s it. No tubes, no injections, no prep. The radiation exposure is extremely low—roughly comparable to the amount of natural background radiation we receive in daily life [International Society for Clinical Densitometry, “DXA Best Practices,” accessed April 29, 2026.]
Your T-score compares your bone density to that of a healthy 30-year-old adult of the same sex. Sounds reasonable at first. But here’s the catch: that “healthy 30-year-old” is usually based on a white reference population—even if you’re not white. Unless your clinic or technician specifically selects a race-adjusted reference database (and many don’t), the T-score reflects how your bones stack up against the bones of a young white woman, no matter your ancestry [Sheila Baim et al., “Official Positions of the International Society for Clinical Densitometry and Executive Summary of the 2007 ISCD Position Development Conference,” Journal of Clinical Densitometry 11, no. 1 (2008): 75–91.] As we will see, that matters. Here’s how to understand the score.
A T-score of:
- 0 to -1.0 is considered “normal” (what a healthy 30-year-old white woman would have)
- -1.0 to -2.5 is called osteopenia (low bone mass)
- Below -2.5 is osteoporosis
These scores are important. A very low T-score (say, -2.5 or lower) is an independent risk factor for fracture, regardless of whether you’ve dropped rapidly or gradually. However, both the rate of change and the change from your personal baseline matter too. And these factors may sometimes be overlooked.
Your Personal Relative Decline
The T-score gives you an absolute number—a snapshot in time. What it doesn’t tell you is how much bone you have lost from your own personal high point. And that matters.
You could have a T-score that looks “fine” on paper—say, -1.1—but if you started out with naturally high bone density, that might reflect a significant and risky drop. And on the other end of the spectrum, some people may have scores that look low simply because their bones have always been naturally less dense, even if they haven’t lost much and their fracture risk remains low.
The Personal Rate at Which You Lose Bone Mass
Fracture risk isn’t only about hitting a diagnostic threshold. A substantial drop from your personal peak—especially if it happens quickly—can indicate declining bone strength, even if your T-score isn’t yet in the osteoporosis range.
So, how fast is too fast? According to the Study of Women’s Health Across the Nation (SWAN), it’s normal to lose about 2–3% of bone mass per year during the first 3–5 years after menopause [Greendale et al., “Bone Mineral Density Loss,” 111–118.] This natural acceleration is physiologically expected. However, if bone loss exceeds that—say, more than 6–7% within two years—this may be considered rapid bone loss and a clinical red flag, especially if it’s not part of the expected menopausal window or continues beyond it.
Let’s say your peak bone mass at age 30 was exceptionally strong—say, a T-score of +1.0 or more. And then you go through menopause at 50, lose bone rapidly, and land at -1.5 by age 60. That puts you in the “osteopenia” range. On paper, it doesn’t look alarming. But in reality, you’ve lost a significant portion of your bone mass—perhaps over 20%—in a relatively short period of time. That kind of loss, even if the final score isn’t “osteoporotic,” could signal increased fracture risk. Context matters. And, speaking of context…
It’s also worth remembering that not all bone loss is simply “age-related” or menopausal. A faster-than-expected decline can sometimes point to other contributors—such as thyroid imbalance, elevated parathyroid hormone, chronic stress and cortisol exposure, certain medications (including steroids, some antidepressants, proton pump inhibitors, and aromatase inhibitors), or issues with nutrient absorption. When bone loss seems out of proportion to what we would expect, it may be worth asking what else is influencing the terrain.
Osteoporosis Isn’t One-Size-Fits-All
Bone density varies across different populations:
- Black women tend to have higher peak bone density, so they can lose more before it shows up in the danger zone of the T-score. This means they may be told everything looks fine—even if they’ve already lost 15–20% of their bone mass and are now at increased fracture risk because of their significant personal decline. The T-score may appear “normal,” but it’s masking real vulnerability [Ayse Zengin, Ann Prentice, and Kate A. Ward, “Ethnic Differences in Bone Health,” Clinical Reviews in Bone and Mineral Metabolism 13 (2015): 1–15.]
- Asian women often have lower baseline bone density, which may show up as osteopenia or osteoporosis on paper—even if they’ve lost very little from their peak. In other words, they may get flagged as high risk simply because their bones were never especially dense to begin with, even though their personal loss has been minimal and their actual fracture risk may be lower than that of a white woman with the same T-score [Zengin, Prentice, and Ward, “Ethnic Differences in Bone Health,” 1–15.]
- South Asian women, like many of Indian descent, are often underrepresented in studies altogether. Their bone density, vitamin D status, and dietary patterns may be unique—but there’s no widely accepted reference range tailored to them. Which means their scores are being interpreted through someone else’s lens [Zengin, Prentice, and Ward, “Ethnic Differences in Bone Health,” 1–15.]
Enter FRAX
Because T-scores don’t tell the whole story, many clinicians also use a tool called FRAX—the Fracture Risk Assessment Tool developed by the World Health Organization [John A. Kanis et al., “FRAX and the Assessment of Fracture Probability in Men and Women from the UK,” Osteoporosis International 19, no. 4 (2008): 385–397.] Unlike DEXA, this is not a scan–it’s a questionnaire-based algorithm designed to estimate your 10-year risk of a major osteoporotic fracture (hip, spine, wrist, or shoulder), with or without a DEXA result.
FRAX factors in:
- Age – Risk increases steadily with age and depletion of sex hormones, especially after menopause.
- Weight and height – Low body weight is a risk factor because smaller bones have less mass to lose, and lower levels of sex hormones are more common in underweight individuals.
- History of prior fractures – A past fragility fracture (one caused by a minor fall or bump) is a strong predictor of future fractures, even if bone density appears “normal.”
- Steroid use – Long-term use of glucocorticoids (like prednisone) weakens bone and increases resorption.
- Smoking and alcohol use – Both can reduce bone formation, increase bone breakdown, and interfere with calcium and vitamin D metabolism.
- Rheumatoid arthritis – This autoimmune disease increases fracture risk both due to inflammation and common use of bone-depleting steroids.
- Family history of hip fracture – Genetics play a role; a parental hip fracture increases your own risk, independent of your T-score.
- (Optional) Femoral neck T-score – Including this measurement from a DEXA scan can improve FRAX’s accuracy by providing a clearer picture of current bone status.
In the U.S. version of FRAX, you can also select race or ethnicity—but only from a limited menu:
- White
- Black
- Hispanic
- Asian-American
That’s it. No South Asian, Native American, Middle Eastern, Pacific Islander, or mixed-race categories. Outside the U.S., many country-specific versions of FRAX don’t include race at all. So while FRAX does attempt to adjust fracture risk for race and ethnicity, the categories are incomplete, and based on limited data. It’s a small improvement on the T-score, but it still fails to capture the personal context, and it can’t measure how fast your bone is declining or the quality of the bone you have left.
I would personally also add “stress level” to this list because cortisol increases with stress, and elevated cortisol can hammer bone density in no fewer than seven ways: (1) mobilizes calcium from bones, (2) activates osteoclasts, (3) inhibits osteoblasts, (4) breaks down structural tissues—muscle, bone, skin, brain, (5) decreases mineral absorption in the gut, (6) increases renal calcium loss, and (7) increases protein breakdown. If our bone density is low and our doctors aren’t asking us about our stress level, we should at least be aware it is an important factor.
A New Player: Echolight and the Promise of REMS Technology
If T-scores give us only part of the story, and tools like FRAX help but still fall short, there’s another option worth knowing about: Echolight, a device that uses Radiofrequency Echographic Multi-Spectrometry, or REMS, to assess bone health. REMS is ultrasound-based and radiation-free, and it estimates bone mineral density at the lumbar spine and femoral neck. Its appeal is clear: it is portable, quick, painless, and avoids radiation exposure [Marco Di Paola et al., “Radiofrequency Echographic Multispectrometry Compared with Dual X-ray Absorptiometry for Osteoporosis Diagnosis on Lumbar Spine and Femoral Neck,” Osteoporosis International 30, no. 2 (2019): 391–402.]
Research published in 2025 and 2026 suggests we should be careful about how we interpret REMS results. REMS does not produce the same kind of image that a DEXA scan does, so it may not reveal vertebral compression fractures or other structural findings that can affect interpretation.
Two studies have raised a other questions: how much of a REMS result comes from the ultrasound signal itself, and how much comes from demographic information such as age, sex, weight, and BMI [Martin Bobelyak, Jan Vaculík, and Jan J. Štěpán, “Bone Mineral Density Assessment Using Radiofrequency Echographic Multispectrometry (REMS) in Patients Before and After Total Hip Replacement,” Osteoporosis International (2025); D. Chan et al., “Demographic Determinants of REMS-Derived BMD and Fragility Score,” Osteoporosis International, published online March 23, 2026.]
In the 2026 study by Chan and colleagues, age and weight explained more than 90% of the variance in REMS-BMD, and age alone explained much of the Fragility Score. In a smaller experimental portion of the study, changing the age or weight entered into the REMS system altered the result, even though the person’s bone had not changed [Chan et al., “Demographic Determinants of REMS-Derived BMD and Fragility Score.”]
This does not mean REMS is without value. It may correlate with DEXA at a population level. But it suggests that REMS may be less reliable when applied to individuals whose bone health differs significantly from what would be predicted based on age and body size.
DEXA remains the clinical standard for diagnosis and treatment decisions. REMS may still be useful when DEXA is unavailable, when radiation is best avoided, when a patient cannot be transported easily, or when degenerative changes or hardware make DEXA harder to interpret. But for most people with access to DEXA, REMS may be best understood as a supplementary tool rather than a replacement [K. Zambito et al., “Proposed Practice Parameters for the Performance of Radiofrequency Echographic Multispectrometry (REMS) Evaluations,” Bone & Joint Open 6, no. 3 (2025): 291–297.]
A brief summary of where REMS may help and where caution is warranted:
Possible benefits:
- Radiation-freer
- Portable and useful when DEXA access is limited
- Quick and painless
- May be useful when a patient cannot easily travel to a DEXA facility
- May offer additional context when DEXA is difficult to interpret due to spinal degeneration, surgical hardware, or other artifacts
- May prompt follow-up testing in people who might otherwise avoid bone assessment
Limitations and cautions:
- DEXA remains the clinical standard for diagnosis and treatment decisions
- REMS does not provide the same kind of bone image that DEXA does
- It may miss vertebral compression fractures or structural changes
- Recent studies suggest REMS results may be strongly influenced by age, weight, sex, and BMI [Bobelyak, Vaculík, and Štěpán, “Bone Mineral Density Assessment Using Radiofrequency Echographic Multispectrometry”; Chan et al., “Demographic Determinants of REMS-Derived BMD and Fragility Score.”]
- REMS and DEXA results are not interchangeable
- It may be less reliable for people whose bone health is significantly better or worse than expected for their demographics
- It is not yet well established for tracking treatment response over time
Other Tests That May Add Useful Information
If we want more information than a standard DEXA provides, there are better-established additions to consider.
A Trabecular Bone Score (TBS) can be derived from a standard DEXA image and provides indirect information about the internal structure of bone. It can improve fracture risk prediction when used alongside FRAX [Eugene V. McCloskey et al., “A Meta-analysis of Trabecular Bone Score in Fracture Risk Prediction and Its Relationship to FRAX,” Journal of Bone and Mineral Research 31, no. 5 (2016): 940–948.]
A Vertebral Fracture Assessment (VFA) is a low-radiation side-view scan of the spine that can be done with DEXA. It looks for vertebral compression fractures, many of which occur without obvious pain and may go unnoticed for years. In other words, a person may have a fracture and not know it. This matters because having one vertebral fracture is one of the strongest predictors of having another [International Society for Clinical Densitometry, “2023 ISCD Official Adult Positions,” accessed April 29, 2026; Felicia Cosman et al., “Clinician’s Guide to Prevention and Treatment of Osteoporosis,” Osteoporosis International 25, no. 10 (2014): 2359–2381.]
Bone turnover markers—such as CTX (resorption) and P1NP (formation)—offer a different kind of information. While imaging shows where bone density is now, these blood tests reflect how actively bone is being broken down or rebuilt and can respond within months to changes in treatment or lifestyle [Pierre Szulc et al., “Use of CTX-I and PINP as Bone Turnover Markers: National Bone Health Alliance Recommendations to Standardize Sample Handling and Patient Preparation,” Osteoporosis International 28, no. 9 (2017): 2541–2556.]
The Sitting-Rising Test (SRT): A Simple Test That Might Tell Us a Lot
We’ve talked about T-scores, DEXA scans, REMS technology, and fracture risk models. But there’s another tool—completely free, functional, and often more revealing than we give it credit for.
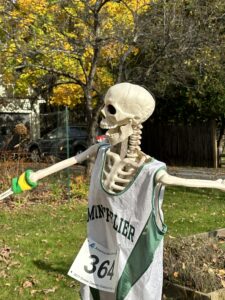 It’s called the Sitting-Rising Test (SRT).
Here’s how it works:
Start standing, then sit cross-legged on the floor—and stand back up again—without using your hands, arms, knees, or sides of your legs for support. You begin with a score of 10. Subtract one point for each body part you use to help yourself down or up. If you wobble, subtract a half point.
This isn’t a diagnostic test. It doesn’t measure bone density. But research has shown that lower SRT scores are associated with higher risk of falls, fractures, and even mortality. One large study found that people over 50 who scored in the 0–3 range were 5–6 times more likely to die over the next six years than those with perfect scores. Each point on the SRT scale correlated with roughly a 21% improvement in survival odds [Luciano B. B. de Brito et al., “Ability to Sit and Rise from the Floor as a Predictor of All-Cause Mortality,” European Journal of Preventive Cardiology 21, no. 7 (2014): 892–898; Claudio Gil S. Araújo, Carlos G. de Souza e Silva, and Jari A. Laukkanen, “Sitting-Rising Test: Sex- and Age-Reference Scores Derived from a 6-Year Observational Study,” Journal of Aging and Physical Activity 33, no. 1 (2025): 98–106.]
Why does this simple test matter? Because it reflects a mix of:
- Leg and hip strength
- Core stability
- Flexibility and balance
- And maybe most importantly, confidence in our body’s ability to move in space
If we struggle to get off the floor, it doesn’t necessarily mean we’re in trouble. But it may mean we’ve lost strength or mobility in ways that are worth addressing—especially if our bone density is already low. Fragility fractures usually don’t happen because someone fell from a ladder. They happen because someone lost their balance in the kitchen or on the stairs—and didn’t have the muscle or coordination to recover.
This simple test points to something it is sometimes easy to forget or minimize: fracture risk is not just about bone density. It reflects both the strength of the bone and the likelihood of falling in the first place. We can think of it as two forces meeting—bone strength and fall risk. Even modest improvements in balance, coordination, and muscle strength can shift that equation in a meaningful way.
Reverse Engineering the Sitting-Rising Test
If the SRT can reflect aspects of our health, and if we score low, maybe we can reverse-engineer the process—and train ourselves to improve. We might be able to do that at home, for free.
One accessible place to start is simply by practicing getting up and down from the floor—safely, slowly, and with control. Try it once a day. Use props or supports if needed at first. Over time, try to use fewer.
If this feels difficult—or if we notice specific areas of tension, weakness, or imbalance, we can work those areas. If we’re not sure how, it can help to work with a trusted exercise professional: a yoga therapist, physical therapist, or personal trainer who can help assess what’s going on in the body and guide a personalized routine to build strength, flexibility, and coordination.
We may not care about the score itself. But we can work toward reclaiming our ability to move, respond, and recover. Especially if our bones are already thinner than we’d like, the muscles around them become our first line of defense.
The Bottom Line
The way we diagnose osteoporosis misses nuance, ignores context, and often fails to account for racial, ethnic, and individual variation.
That doesn’t mean we should panic. It means we ourselves can consider context, better timing, and a more personalized approach to our bone health.
We can ask questions. Get baseline data. And remember: the number on the page is just one piece of the story.
Conclusion: Redefining Our Relationship to Scores and Strength
Most of us move through life without knowing our personal peak bone mass—or how much we’ve lost from it. We’re handed a number and asked to orient our treatment, and our sense of security, around it. But the story is more complicated.
Bone loss unfolds gradually for some, rapidly for others. Some people with “normal” scores may already be at increased risk. Others may be labeled higher-risk when their actual fracture risk isn’t as dire as it might seem. The tools we have—DEXA, FRAX, TBS, VFA, bone turnover markers, and sometimes REMS—can all be useful. But none of them tells the whole story by itself.
Meanwhile, there’s something instructive about noticing whether we can simply still get up off the floor without our hands—or whether that’s getting harder. It’s not a diagnosis, but it might offer a clue about where we are in the arc of strength, balance, or stability.
We’re not likely to find perfect answers in one scan or score. But we use them to help us find better ways to support our bones—and each other—with more clarity and precision.
References
[Araújo, Claudio Gil S., Carlos G. de Souza e Silva, and Jari A. Laukkanen. “Sitting-Rising Test: Sex- and Age-Reference Scores Derived from a 6-Year Observational Study.” Journal of Aging and Physical Activity 33, no. 1 (2025): 98–106.]
[Baim, Sheila, Neil Binkley, John P. Bilezikian, et al. “Official Positions of the International Society for Clinical Densitometry and Executive Summary of the 2007 ISCD Position Development Conference.” Journal of Clinical Densitometry 11, no. 1 (2008): 75–91.]
[Bobelyak, Martin, Jan Vaculík, and Jan J. Štěpán. “Bone Mineral Density Assessment Using Radiofrequency Echographic Multispectrometry (REMS) in Patients Before and After Total Hip Replacement.” Osteoporosis International (2025).]
[Chan, D., et al. “Demographic Determinants of REMS-Derived BMD and Fragility Score.” Osteoporosis International, published online March 23, 2026.]
[Cosman, Felicia, S. J. de Beur, M. S. LeBoff, et al. “Clinician’s Guide to Prevention and Treatment of Osteoporosis.” Osteoporosis International 25, no. 10 (2014): 2359–2381.]
[de Brito, Luciano B. B., D. R. Ricardo, D. S. M. S. de Araújo, et al. “Ability to Sit and Rise from the Floor as a Predictor of All-Cause Mortality.” European Journal of Preventive Cardiology 21, no. 7 (2014): 892–898.]
[Di Paola, Marco, Davide Gatti, Ombretta Viapiana, et al. “Radiofrequency Echographic Multispectrometry Compared with Dual X-ray Absorptiometry for Osteoporosis Diagnosis on Lumbar Spine and Femoral Neck.” Osteoporosis International 30, no. 2 (2019): 391–402.]
[Greendale, Susan L., M. H. Sowers, M. Han, et al. “Bone Mineral Density Loss in Relation to the Final Menstrual Period in a Multiethnic Cohort: Results from the Study of Women’s Health Across the Nation (SWAN).” Journal of Bone and Mineral Research 27, no. 1 (2012): 111–118.]
[International Society for Clinical Densitometry. “2023 ISCD Official Adult Positions.” Accessed April 29, 2026.]
[International Society for Clinical Densitometry. “DXA Best Practices.” Accessed April 29, 2026.]
[Kanis, John A., A. Oden, O. Johnell, et al. “FRAX and the Assessment of Fracture Probability in Men and Women from the UK.” Osteoporosis International 19, no. 4 (2008): 385–397.]
[McCloskey, Eugene V., A. Odén, Nicholas C. Harvey, et al. “A Meta-analysis of Trabecular Bone Score in Fracture Risk Prediction and Its Relationship to FRAX.” Journal of Bone and Mineral Research 31, no. 5 (2016): 940–948.]
[Szulc, Pierre, K. Naylor, N. R. Hoyle, R. Eastell, E. T. Leary, and the National Bone Health Alliance Bone Turnover Marker Project. “Use of CTX-I and PINP as Bone Turnover Markers: National Bone Health Alliance Recommendations to Standardize Sample Handling and Patient Preparation.” Osteoporosis International 28, no. 9 (2017): 2541–2556.]
[Zambito, K., et al. “Proposed Practice Parameters for the Performance of Radiofrequency Echographic Multispectrometry (REMS) Evaluations.” Bone & Joint Open 6, no. 3 (2025): 291–297.]
[Zengin, Ayse, Ann Prentice, and Kate A. Ward. “Ethnic Differences in Bone Health.” Clinical Reviews in Bone and Mineral Metabolism 13 (2015): 1–15.]